New Opportunities – Spring 2018

We’ve been busy lately, including following up on the Data Rescue and Data Integration workshops with more materials to share (you can already access most of them here!), and wanted to share some new opportunities.
EarthCube All Hands Meeting
The EarthCube All Hands Meeting will be held June 6-8, 2018 in Washington, DC (our abstracts here). We are very excited to be able to bring a coral-reef-science guest or two to this meeting through reimbursement of travel and registration costs. Two people who work with coral reef data from a repository perspective will also attend with us as part of the CRESCYNT community. Please email us if you’re interested! (Registration is $250 before May 11)
CoralNET Software Update
CoralNET software for automated analysis of coral reef benthic imagery is getting a revision, and its developers would like your input. What feature improvements and new developments would you like to see? Add your feedback to this thread. More background here. (If you haven’t tried it yet, this is the time to do it – fresh users are a great source of important feedback.)
Nat’l Academies Workshop on Interventions to Increase Resilience of Coral Reefs

interventions-resilience

Attendance is free and open to the public, online or in person.

View the agenda and register.


>>>Go to the blog Masterpost or the CRESCYNT website or NSF EarthCube.<<<

New Opportunities – Spring 2018

CRESCYNT Toolbox – Discovery of Online Datasets

cinergi-coralscreendump
Data discovery at cinergi.sdsc.edu

Announcing recent progress for data discovery in support of coral reef research!

Take advantage of this valuable community resource: a data discovery search engine with a special nose for locating coral reef research data sources: cinergi.sdsc.edu.

A major way CRESCYNT has made progress is by serving as a collective coral reef use case for EarthCube groups that are building great new software tools. One of those is a project called CINERGI. It registers resources – especially online repositories and individual online datasets, plus documents and software tools – and then enriches the descriptors to make the resources more searchable. The datasets themselves stay in place: a record of the dataset’s location and description are registered and augmented for better find and filter. Registered datasets and other resources, of course, keep whatever access and use license their authors have given them.

CINERGI already has over a million data sources registered, and over 11,000 of these are specifically coral reef datasets and data repositories. The interface now also features a geoportal to support spatial search options.

The CINERGI search tool is now able to incorporate ANY online resources you wish, so if you don’t find your favorite resources or want to connect your own publications, data, data products, software, code, and other resources, please contribute. If it’s a coral-related resource, be sure to include the word “coral” somewhere in your title or description so it can be retrieved that way later as well. (Great retrieval starts with great metadata!)

To add new resources: Go to cinergi.sdsc.edu, and click on CONTRIBUTE. Fill in ESPECIALLY the first fields – title, description, and URL – then as much of the rest as you can.

Try it out!

Thanks to EarthCube, the CINERGI Data Discovery Hub, and the great crew at the San Diego Supercomputer Center and partners for making this valuable tool possible for coral reef research and other geoscience communities. Here are slides and a video to learn more.


>>>Go to NSF EarthCube or the CRESCYNT website or the blog Masterpost.<<<

CRESCYNT Toolbox – Discovery of Online Datasets

CoralNet: deploying deep learning in the shallow seas – by Oscar Beijbom

coralnet_oscar-beijbom

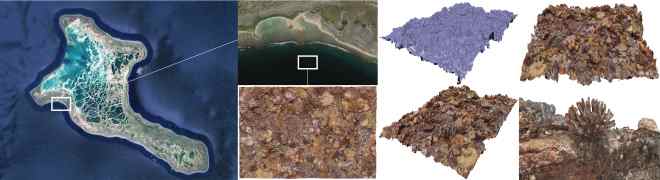
Having dedicated my PhD to automating the annotation of coral reef survey images, I have seen my fair share of surveys and talked to my fair share of coral ecologists. In these conversations, I always heard the same story: collecting survey images is quick, fun and exciting. Annotating them is, on the other hand, slow, boring, and excruciating.

When I started CoralNet (coralnet.ucsd.edu) back in 2012 the main goal was to make the manual annotation work less tedious by deploying automated annotators alongside human experts. These automated annotators were trained on previously annotated data using what was then the state-of-the-art in computer vision and machine learning. Experiments indicated that around 50% of the annotation work could be done automatically without sacrificing the quality of the ecological indicators (Beijbom et al. PLoS ONE 2015).

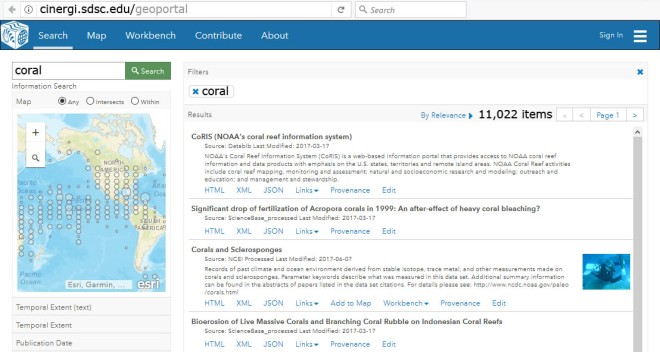
The Alpha version of CoralNet was thus created and started gaining popularity across the community. I think this was partly due to the promise of reduced annotation burden, but also because it offered a convenient online system for keeping track of and managing the annotation work. By the time we started working on the Beta release this summer, the Alpha site had over 300,000 images with over 5 million point annotations – all provided by the global coral community.

There was, however, a second purpose of creating CoralNet Alpha. Even back in 2012 the machine learning methods of the day were data-hungry. Basically, the more data you have, the better the algorithms will perform. Therefore, the second purpose of creating CoralNet was quite simply to let the data come to me rather than me chasing people down to get my hands on their data.

At the same time the CoralNet Alpha site was starting to buckle under increased usage. Long queues started to build up in the computer vision backend as power-users such as NOAA CREP and Catlin Seaview Survey uploaded tens of thousands of images to the site for analysis assistance. Time was ripe for an update.

As it turned out the timing was fortunate. A revolution has happened in the last few years, with the development of so-called deep convolutional neural networks. These immensely powerful, and large nets are capable of learning from vast databases to achieve vastly superior performance compared to methods from the previous generation.

During my postdoc at UC Berkeley last year, I researched ways to adapt this new technology to the coral reef image annotation task in the development of CoralNet Beta. Leaning on the vast database accumulated in CoralNet Alpha, I tuned a net with 14 hidden layers  and 150 million parameters to recognize over 1,000 types of coral substrates. The results, which are in preparation for publication, indicate that the annotation work can be automated to between 80% and 100% depending on the survey. Remarkably: in some situations, the classifier is more consistent with the human annotators than those annotators are with themselves. Indeed, we show that the combination of confident machine predictions with human annotations beat both the human and the machine alone!

Using funding from NOAA CREP and CRCP, I worked together with UCSD alumnus Stephen Chan to develop CoralNet Beta: a major update which includes migration of all hardware to Amazon Web Services, and a brand new, highly parallelizable, computer vision backend. Using the new computer vision backend the 350,000 images on the site were re-annotated in one week! Software updates include improved search, import, export and visualization tools.

With the new release in place we are happy to welcome new users to the site; the more data the merrier!

_____________

– Many thanks to Oscar Beijbom for this guest posting as well as significant technological contributions to the analysis and understanding of coral reefs. You can find Dr. Beijbom on GitHub, or see more of his projects and publications here. You can also find a series of video tutorials on using CoralNet (featuring the original Alpha interface) on CoralNet’s vimeo channel, and technical details about the new Beta version in the release notes.


>>>Go to NSF EarthCube or the CRESCYNT website or the blog Masterpost.<<<

CoralNet: deploying deep learning in the shallow seas – by Oscar Beijbom

CRESCYNT Toolbox – Powerful Temperature Visualizations

Temperature is a critical environmental parameter that has profound relevance in describing where coral reefs do and do not occur, and growing direct and indirect threats to their existence.

Here are some powerful visualizations of global temperature data you may find useful or want to replicate for local or global temperature datasets, or use for education and outreach about climate change.

First, spiralling global temperatures by Ed Hawkins (using MATLAB):

ed_hawkins_globaltempchange_spiral
Click to animate.     Author: Ed Hawkins

The climate spirals page of Hawkins’ Climate Lab Book features global temperature change updates, as well as atmospheric CO2 and arctic sea ice volume animations. His small multiples assembly of global temperatures by decade is very useful, and could be used to describe sequential environmental changes on regional map scales as well.

edhawkins_smmult_year_2016_nobar

Ed Hawkins also links to Robert Geiseke and Malte Meinshausen’s interactive tool and a set of video animations for offline use that build upon his work.

NASA’s temperature graphs and charts are varied and useful, and have pages for downloading different temperature products for specific date ranges, including global maps, surface temperature animations, and this 135-year time chart of zonal temperature anomalies:

nasa_giss_ztmap

See NASA’s Global Climate Change – Global Temperature site for rich multimedia resources and apps, including global temperature anomaly maps with year sliders and an embeddable 3-min video which graphs different potential factors with global temperature changes (surprise: the correlation is with anthropogenic CO2). High global temperatures and low Arctic sea ice cover both broke records in the first half of 2016.

NOAA has its own further derivations of very useful temperature representations, particularly for coral reef work, including global and regional sea surface temperature contour maps,  a suite of coral bleaching data products with predictive bleaching alerts derived from virtual stations, and their degree heating weeks maps, which some NOAA scientists prefer as their most accurate post-event indicator of peak bleaching intensity.

noaa_dhw_20160922

Thanks for inspiration to Andrew Freedman’s excellent article on Mashable featuring compelling temperature visualizations.

If there’s a temperature visualization you love – including simple – simple is good – please share it with us by leaving a comment. Thanks.

Update: (1) fresh updated graphs and more at Ed Hawkins’ Climate Lab Book (or follow on Twitter: @ed_hawkins), and (2) check out Antti Lipponen’s temperature anomalies by country since 1900 – as animation or small multiples – showing variation and warming trends, with visual insight into continents.


>>>Go to the blog Masterpost or the CRESCYNT website or NSF EarthCube.<<<

CRESCYNT Toolbox – Powerful Temperature Visualizations

3D Mapping of Coral Reefs – How to Get Started – by John Burns

Rapid technological advancements are providing a suite of new tools that can help advance ecological and biological studies of coral reefs. I’ve studied coral health and disease for the last several years. One large gap in our research approach is the ability to connect changes in coral health to large-scale ecological processes. I knew that when corals died from disease it would alter the fundamental habitat of the system, which in turn would impact associated reef organisms. What I didn’t know was how to effectively document and quantify these changes. Sometimes we just need to alter our perspective to find the answers we are looking for. I starting reviewing methods used by terrestrial researchers to measure landscape changes associated with landslides and erosion. In doing so I came across structure-from-motion (SfM) photogrammetry, and it was immediately clear that this technique could improve our understanding of coral reef ecosystems. I spent the next few years developing methods to use this approach underwater, and have since used SfM to detect changes in reef structure associated with disturbances as well as improve our understanding of coral diseases.
 kiritimati_nature_figure

The first question I am usually asked is, “How easy is it to use this technique and what does it cost?” The best answer I can provide is the logistic constraints depend on your research question. If you are interested in accuracy and controlling the parameters of the 3D reconstruction process, then you should use proprietary software like Agisoft PhotoScan and Pix4D. These programs give you full control, yet require more understanding of photogrammetry and substantial computing power. Autodesk ReCap can process images remotely, which reduces the need for a powerful computer, but also reduces your control over the 3D reconstruction process. At the most simple level, you can download the Autodesk 123D catch app on your phone and create 3D reconstructions in minutes! There are also multiple open-source software options, but they tend to be less powerful and lack a graphical user interface. My advice is to start small. Get started with some simple and free open source tools such as Visual SfM or Bundler. Collect a few sets of images and get some experience with the processing steps to determine if the model outputs are applicable for your research approach.

The second question I receive is, “What is the best way to collect the images?” Unfortunately, the answer is not to use the ‘auto’ setting on your camera and just take a bunch of pictures. Image quality will directly affect the resolution of your model, and is also important for stitching and spatial accuracy. Spend time to understand the principles of underwater photography. A medium aperture (f-stop of 8 to 11) will let in enough light in ambient conditions while not causing blur and distortion associated with depth of field. Since images are taken while moving through a scene, a high enough shutter speed is required that will eliminate blur and dark images. Since conditions can be highly variable, one must adapt to changes in light and underwater visibility while in the field. Cameras with auto-ISO can be helpful for dealing with changing light conditions while surveying. I also recommend DSLR or mirrorless cameras with high-quality fixed lenses, as they will minimize distortion and optimize overall resolution and clarity. For large areas I won’t use strobes because I take images from large distances off the reef, and this will typically create shadows in the images. I take images of the reef from both planar and oblique angles to capture as much of the reef scene as possible in order to eliminate ‘black holes’ in the resulting model. There is no ‘perfect approach,’ but you will need 70-80% overlap for accurate reconstruction. I swim in circular or lawn-mower patterns depending on the scene, and swear by the mantra that more is better (you can always throw out images later if there is too much overlap). It is worth investing time in experimenting with methods to develop a technique that works best for your study are and experimental design. SfM is a very flexible and dynamic tool, so don’t be afraid to create your own methods.

The third question is then, “How do you ground-truth the model for spatial accuracy?” This is a critical step that often gets overlooked. In order to achieve mm-scale accuracy the software must be able to rectify the model to known x,y,z coordinates. I use mailbox reflectors connected by PVC pipe to create ground control points (GCPs) with known distances. The red color and white outline of the reflectors is easily distinguished and identified by the software and saves a lot of time for optimizing the coordinates of the model. Creating functional GCPs is exceptionally important is spatial accuracy is required for your work. I also use several scale bars throughout my reef plots to check accuracy and scaling. This step of the process is critical for accurately measuring 3D habitat characteristics.

Maybe I’ve taken you too far into technical details at this point, but hopefully this helps for anyone looking to venture into the world of SfM. There is no perfect approach, and we must be adaptable as software continues to improve and new tools are constantly being created. We also need to continue to develop new methods for quantifying structure from 3D models. I export my models into geospatial software to extract structural information, but this step of the process can be improved with methods capable of annotating the true 3D surface of the models. As new software becomes available for annotating 3D surfaces we are entering an exciting phase with endless possibilities for collating and visualizing multiple forms of data. Being open-minded and creative with these techniques may provide new insight into how these environments function, and how we can protect them in the face of global stressors.
– Mahalo to John Burns for this in-depth guest posting. You can see more of his work, simultaneously beautiful and useful, at the Coral Health Atlas. Click on the image below for more of John’s remarkable 3D coral reef mapping work:
johnburns_sketchfab
>>>Go to NSF EarthCube or the CRESCYNT website or the blog Masterpost.<<<
3D Mapping of Coral Reefs – How to Get Started – by John Burns

CRESCYNT Toolbox – Stitched Images – 3D Reef Mapping and 360-Degree Imagery

Imagery REALLY feeds our monkey brains. Today: tools for 3D reef mapping. Bonus: some 360-degree images and video to use with virtual reality headsets.

Several exciting talks at the International Coral Reef Symposium featured 3D mapping of coral reefs using SfM, Structure from Motion techniques, to stitch together large numbers of overlapping images. The resulting 3D mapped images were used to help address a surprising range of research questions. The primary tools used to create these were Agisoft’s PhotoScan or the free and open source Bundler (github) by Noah Snavely.  Part of the challenge of this difficult work is organizing the workflows and data processing pipelines: it’s an example of a type of cyberinfrastructure need that eventually EarthCube architecture should be able to help stage. Look for a guest blog soon by John Burns to learn more!

valensreef2
360 Film by Conservation International

BONUS: The process of creating spherical or 360-degree images or video is at root a similar challenge of stitching together images, though more of the work is done inside a camera or on someone else’s platform. There are some recent beautifully-made examples of spherical coral reef images and 360 videos, viewable through virtual reality (VR) headsets; these have great potential for education and outreach. Consider the XL Catlin Seaview Survey gallery of coral reef photo spheres and videos from around the world, (including bleaching and before-and-after images) and Conservation International’s 8-minute video, Valen’s Reef, both exhibited at the current IUCN World Conservation Congress in Honolulu.

catlinseaviewsurvey
Catlin Seaview Survey – equipment

A new project, Google Expeditions, was launched this past week to facilitate synchronized use by multiple people of 360 videos and photo spheres as a design for class use. Google Streetview is being made more accessible as a venue for education and outreach, including creating and publishing one’s own photo spheres. Also find 360-videos of coral reefs on YouTube.

UPDATE: Visually powerful 360 bleaching images that Catlin Seaview debuted at ICRS, viewed by tablet or smartphone, are now accessible in this article on coral bleaching.

>>>Go to the blog Masterpost or the CRESCYNT website or NSF EarthCube.<<<

CRESCYNT Toolbox – Stitched Images – 3D Reef Mapping and 360-Degree Imagery

CRESCYNT Toolbox – Unifying a Search Through Species Databases

If the only tool you have is a hammer, everything looks like a nail.

wrench-503131_960_720
CRESCYNT wrenches

Our new Toolbox series for the coral reef community will highlight one tool each week relevant to data management, analysis, visualization, storage, retrieval, reuse, or collaboration. We’ll try to focus on the most comprehensive, useful, and relevant tools for coral reef work.

We hope you’ll take time to try each one out, and then tell us what you think.

~~~~~~~~~~~~~~~~~~

This week:  Biodiversity information aggregated at GBIF (http://gbif.org ).

The Global Biodiversity Information Facility (GBIF) pulls together species and taxonomic entries from over 800 authoritative data publishers and constantly updates them. GBIF intake includes favorite coral reef species databases (WoRMS, iDigBio, ITIS, Paleobiology,…). Bonus: GBIF makes it easier to search NCBI to find ‘omics data on corals, symbionts, and holobionts.

Search by taxon, common name, dataset, or country; apply filters, and link directly to providers’ websites. Explore species now at http://gbif.org/species .

Yours for a more robust toolbox.

gbif


>>>Go to the blog Masterpost or the CRESCYNT website or NSF EarthCube.<<<

CRESCYNT Toolbox – Unifying a Search Through Species Databases

CRESCYNT at ICRS 2016

CRESCYNT IS AT #ICRS2016 – International Coral Reef Symposium in Honolulu, Hawaii!

EVENTS:

WORKSHOP – Cyber Tools and Resources for Coral Reef Research and Analysis
Sun. June 19 8:30am-4:00pm, Hawaii Convention Center rm 314
(breakfast, lunch provided – register here)
ask about materials / future webinars if you miss
sponsored by EarthCube CRESCYNT – some seats still open!

CRESCYNT Node Coordinators Meeting
Mon June 20 6:00-8:30pm, Hawaii Convention Center 307 A/B

OPEN MEETING – CRESCYNT Participants with Node Coordinators
Wed June 22, 11:30am-12:45pm, Hawaii Convention Center 307A/B
(bring your ICRS lunch – we’ll have ice cream)
OPEN TO ALL – come if you’re interested!

DISCUSSION & SYNTHESIS SESSION: Emerging Technologies for Reef Science and Conservation
Fri June 24, 9:30am-3:45pm, Hawaii Convention Center 312icrs2016-footer
(Discussion 11-11:30am. CRESCYNT at 2pm)

UPDATE: Find all the meeting abstracts in this 414-page pdf book


>>>Go to the blog Masterpost or the CRESCYNT website or NSF EarthCube.<<<

CRESCYNT at ICRS 2016

CRESCYNT at Ocean Sciences Meeting 2016 – and nearly 100 coral reef presentations!

The 2016 Ocean Sciences Meeting is coming up in New Orleans 21-26 February 2016, and we hope to see you there! There are 97 oral and poster session presentations scheduled with CORAL in the title (plus a lunchtime presentation from CRESCYNT, making 98), and we hope to talk with coral reef researchers about YOUR needs and priorities for data, analysis, and cyberinfrastructure.

1 – Joint lunchtime discussion held with iSamples, CRESCYNT, and SeaView on Monday, Feb. 22, 12:30-2:00pm. Lunch will be provided! Register at http://bit.ly/1QFHLd1.

2 – CRESCYNT coral reef RCN will be at the EarthCube exhibitor booth 507 periodically, including Tuesday, Feb. 23, 9:30am – 2:00pm and on other days by appointment. Come by at that time or any time to fill out a CRESCYNT priority survey and learn more about EarthCube.

3 – Please email us at crescyntrcn@gmail.com to set something up. We’d love to talk with you while at OSM (or any other time).

The chart below shows when the coral-related oral papers and poster sessions will take place. Hope to see you there!

Coral Presentations at OSM 2016

>>>Go to the blog Masterpost or the CRESCYNT website or NSF EarthCube.<<<

CRESCYNT at Ocean Sciences Meeting 2016 – and nearly 100 coral reef presentations!